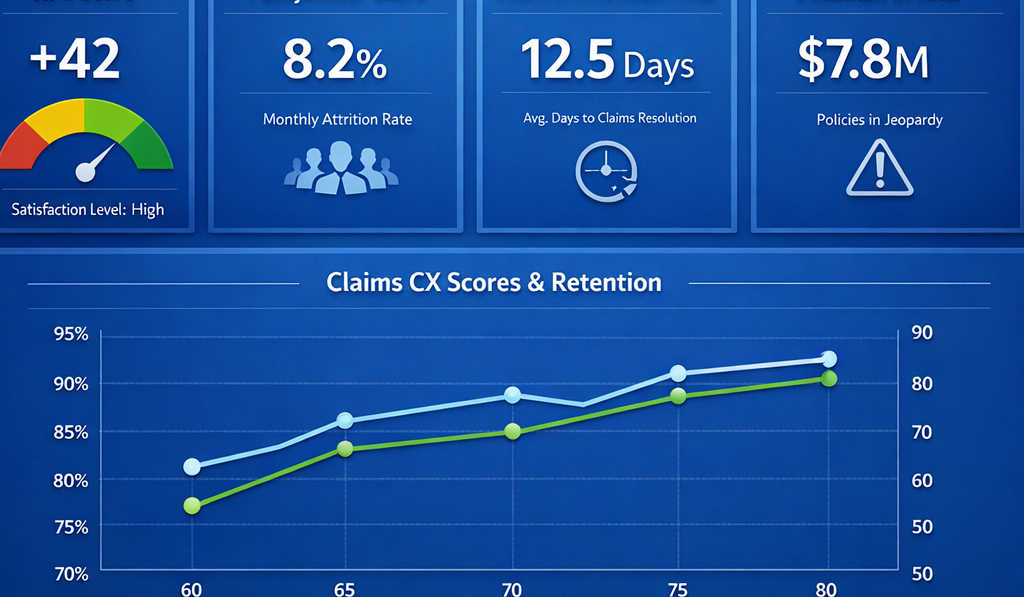
How insurers can link claims experience metrics to retention, CLV, and strategic investment decisions in the C-suite.
The retention math behind claims experience ROI
Every insurance executive can repeat the mantra “claims is our shop window,” but too few can quantify what a good or bad claims experience is worth in dollars. In a hard market, that gap becomes dangerous. Pricing pressure, CAT volatility, and regulatory scrutiny mean every basis point of combined ratio matters—and yet many carriers still treat claims customer experience as a soft concept, measured in occasional surveys and anecdotes rather than a disciplined ROI model. The stakes are not theoretical. Independent research has repeatedly shown that dissatisfaction with claims is one of the top reasons customers switch carriers. A widely cited Accenture study found that more than 30% of policyholders were not fully satisfied with their most recent claim; of that group, nearly one-third had already switched carriers and almost half were considering it, putting tens of billions in premium at risk each year. A 2024 whitepaper on claims experience and retention translates that into hard numbers: as much as $170 billion in global premiums could be in play over five years if carriers fail to fix claims CX; a concise summary of the findings is available at Optimizing the Claims Experience. At the same time, digital claims benchmarks from firms like J.D. Power show that communication and transparency now matter as much as raw speed. In its 2024 U.S. auto claims study, J.D. Power notes that 80% of customers who have poor claims experiences have already left or say they plan to leave, and highlights clear communication, expectation-setting, and digital status updates as key drivers of satisfaction—even when repair cycle times are still longer than pre-pandemic norms; see the full discussion at J.D. Power Auto Claims 2024. For carriers investing in automation, workbenches, and AI governance, this is both a challenge and an opportunity. You need a way to show that FNOL automation, event-driven notifications, and adjuster copilots are not only cutting LAE, but also protecting premium and strengthening broker relationships. That requires moving beyond generic “customer satisfaction” charts toward an integrated claims experience ROI model—one that connects NPS and CSAT to retention, cross-sell, and lifetime value, and that your CFO can trust. This post outlines how to build that model in three steps: quantify the retention math, design a measurement architecture, and translate insights into board-ready decisions.
Building a claims CX measurement architecture
To move from anecdotes to management, you need a claims CX measurement architecture that captures the right signals, links them to business outcomes, and surfaces them in a way executives can act on. Start with the journey map, not the system diagram. For each major claims segment—auto, home, SME, specialty—define the key touchpoints: FNOL, documentation, inspection, coverage confirmation, settlement, and any dispute stages. Instrument these with both operational and experiential metrics. Operationally, measure FNOL-to-first-contact latency, FNOL-to-triage, claim cycle time (median, P75/P95), touches per claim, percentage of proactive notifications sent, and self-service completion rates. Experientially, attach CSAT or NPS pulses at one or two “moments of truth” rather than spamming customers: for example, after coverage is confirmed and after payment. Customer research shows that communication quality often matters as much as raw speed; a recent whitepaper summarizing Accenture research found that more than 30% of customers were dissatisfied with a recent claim, and of those, 30% had already switched carriers and 47% were considering it—putting an estimated $170 billion of premiums at risk over five years; see the analysis and retention framing in Claims Experience and Retention. Normalize these signals into a consistent claims CX scorecard for each line—combining NPS, cycle time, and communication SLAs—and tie every record back to anonymized customer IDs so you can study behavior over time. Do not treat claims NPS as an island. Connect it to renewal and cross-sell data in your CRM or data warehouse, and to complaint and escalation flags in your service systems. External benchmarks help you calibrate what “good” looks like: sector-wide insurance NPS studies show average scores in the mid-30s, with leaders like Allianz, USAA, and Bright Health achieving scores above 70 by investing heavily in service design and digital access; a recent benchmark compilation of 25 insurance NPS scores provides useful context at Insurance NPS Benchmarks, while B2B-focused benchmarkers track similar trends for commercial carriers and brokers at Insurance NPS Benchmarks 2024. Finally, bring external sentiment into the picture. Monitor public review scores and broker survey data for claims-specific feedback, and fold that into the same dashboards. The goal is a 360° view where operational friction and customer frustration show up as one story, not scattered anecdotes pulled together before every board meeting.
Turning claims CX insights into C-suite decisions
With the data foundation in place, the task is to translate claims CX into language the C-suite lives in: revenue, margin, and risk. Start by building simple, defensible models that quantify how changes in claims experience move retention and customer lifetime value. For each major line and segment, compare renewal and cross-sell behavior across cohorts defined by claims experience: customers with no claims, those with “great” claims experiences (high NPS/CSAT, short cycle times, few complaints), and those with “poor” experiences (low scores, long tails, escalations). Control for severity and pricing where possible. Industry research suggests the effect size is meaningful. NPS studies across financial services show promoters have 2.5x the lifetime value of detractors and are far less likely to churn; in insurance specifically, the average NPS sits around +35, but leaders posting 60+ scores see meaningfully higher growth and retention; see aggregated metrics and company-by-company scores in Insurance NPS Guide. Pair this with dynamic claims data: if a segment’s claims NPS drops by 10 points and churn rises by, say, 3 percentage points, you can back into an implied premium-at-risk figure and a payback window for CX and automation investment. Turn these insights into a claims CX P&L. Quantify the “cost of bad claims” as lost premium (foregone renewals and cross-sell), higher acquisition costs to replace churned customers, and operational drag from rework and complaint handling. On the positive side, attribute reductions in LAE, cycle time, and contact-center volume to specific initiatives such as guided FNOL, event-driven notifications, and evidence-linked adjuster workbenches. Studies of digital claims transformations have documented 20–30% reductions in cycle times and strong links between proactive communications and improved satisfaction scores; recent J.D. Power claims research highlights that digital status and better expectation management lift satisfaction even when repair times remain elevated; see the discussion of communication and premium-at-risk in its latest auto claims study at J.D. Power Auto Claims. Package this into an executive dashboard that updates monthly. At a glance, your CEO and CMO should see: claims CX scores by line; churn and CLV by experience cohort; premiums at risk; and the ROI of specific claims initiatives. Overlay campaign themes—automation, modernisation, customer experience, trust & compliance—so leadership can see how investments in FNOL automation, adjuster copilots, and AI governance are not just “IT projects” but levers in a quantified value story. When you can show that a one-point improvement in claims NPS for a target segment protects $X million in annual premium and shortens payback on modernisation by Y months, claims CX graduates from soft metric to board-level KPI.